Extract & visualize your own Twitter data using Google Apps Script & Google Sheets
Use Apps Script to normalize your tweet data into tabular format for easy visualization & analysis.

If want to get your data out of Twitter, and be able to visualize it with very little effort, this is for you. Use Apps Script to normalize your tweet data into tabular format for easy visualization & analysis.
The approach I am describing will focus on just the "tweet" data, getting it into tabular format for easy analysis in Google Sheets/Excel, and visualizing it in something like Google Data Studio. Note: with very little effort, you can use this same code/process to convert the rest of the data into tabular format as well.
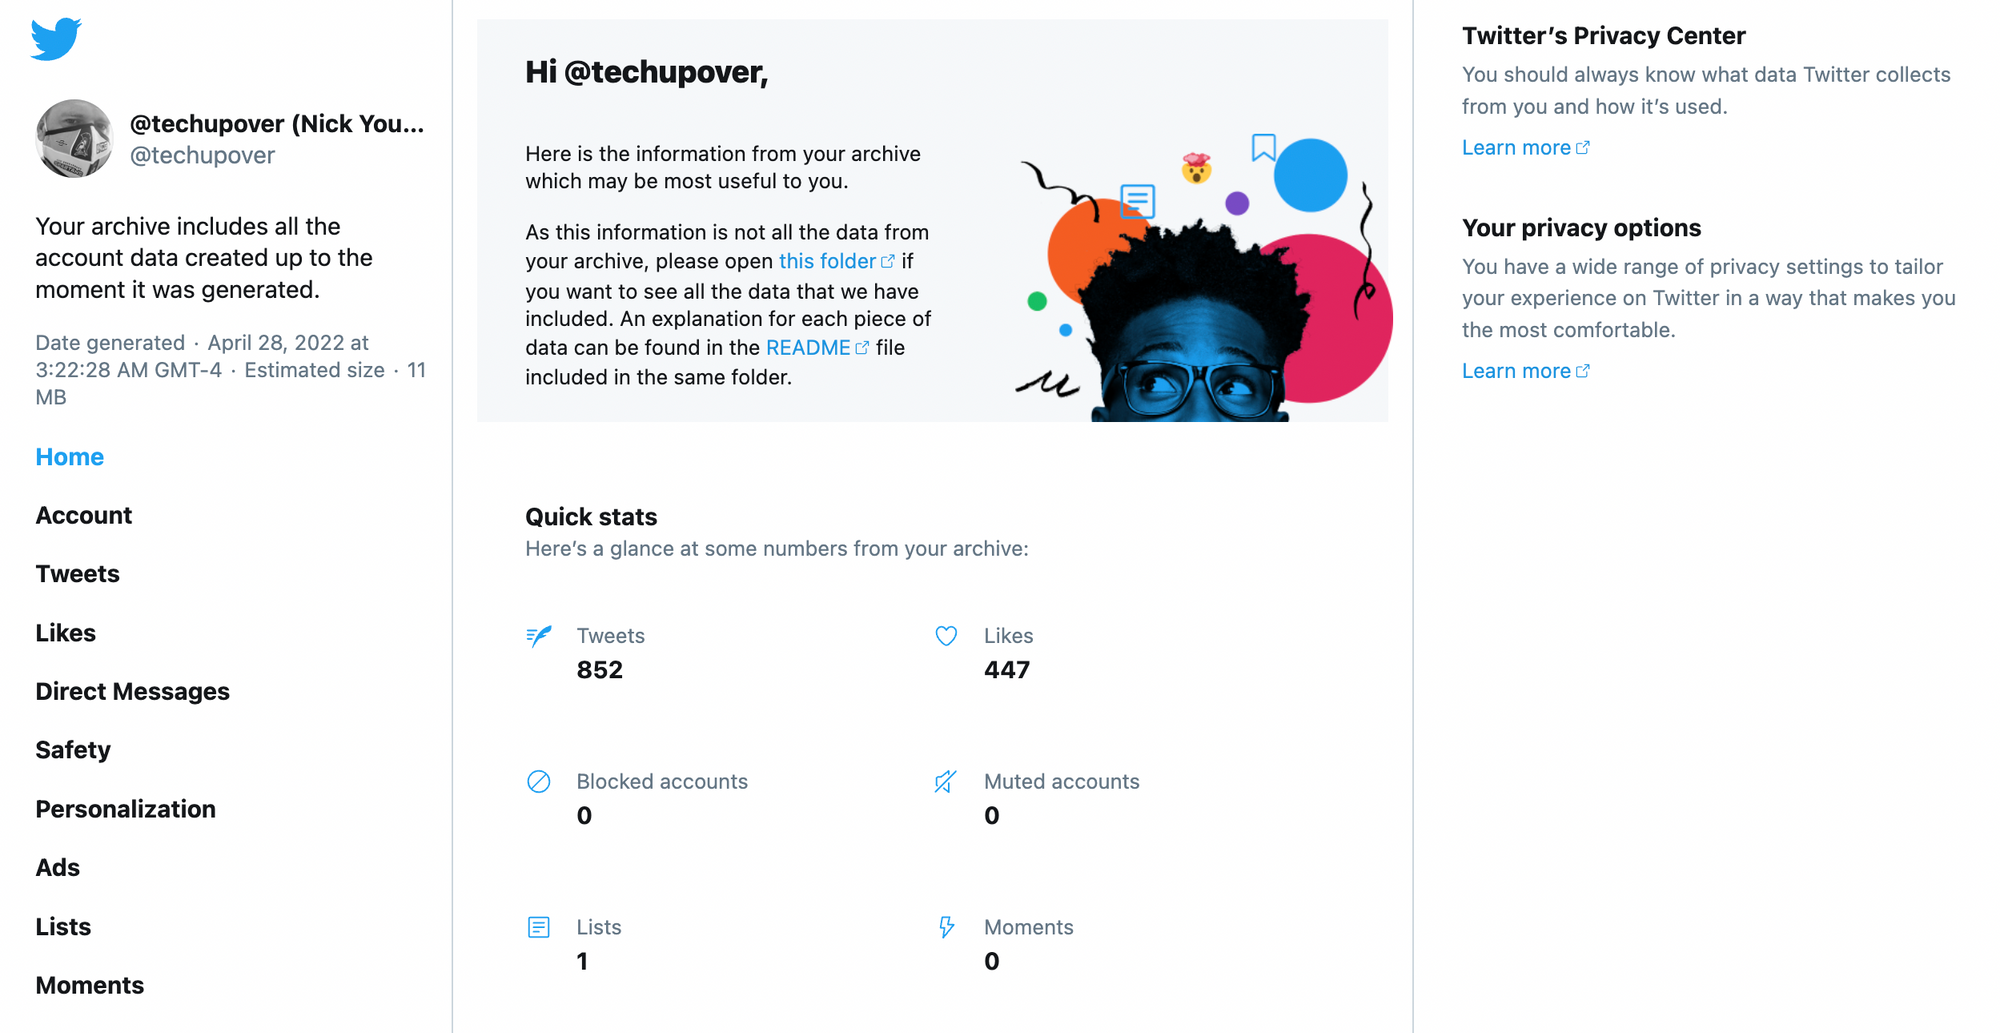
Twitter provides an option to download "all" your data as a zip file. Inside that zip file is a canned HTML file that you can open and browse around the data. It looks something like the screenshot below.... BUT .....if you want it as tabular data, or want to combine data from multiple accounts, just keep reading below for my process to parse that downloaded tweet data into a more usable format.
Let's get started.
COMPONENTS / PRE-REQUISITES
- Twitter account
- Apps Script (script.google.com)
- Google Drive (to store the tweet.js file)
- Google Sheet (to store the normalized tabular data)
- Google Data Studio (optional extra for bonus points)
EXTRACT YOUR TWITTER DATA
At time of writing, here's how:
- log into your Twitter account in a browser (this doesn't work on mobile), and click MORE –> SETTINGS & PRIVACY --> "Download an archive of your data"
- Follow the on-screen instructions to request your data.
- When it's ready, you'll get an email telling you...and then you just go back to the same place, and download the zip file.
- For reference, I've had one of my accounts since 2008, and it took just under 24 hours to receive notification that my zip file was ready.
- Open the zip file, and locate the tweet.js file, which should be in the /data/tweet.js path inside the zip file.
- Copy the tweet.js file to your Google Drive
- Click on the tweet.js file in google drive, and copy the link to it. It will look something like "https://drive.google.com/file/d/1vPIx2oevcxrFi-pO2-7gXRsOm3v-v/view?usp=sharing"
- You need to copy/paste the ID part of that URL, so just keep that tab open for later
SETUP THE GOOGLE SHEET & APPS SCRIPT
QUICKEST OPTION: COPY A TEMPLATE GOOGLE SHEET
- Click on this link to copy the template google sheet. You will be prompted to save the google sheet into your own account, which comes with the appscript code embedded too...which looks like this:
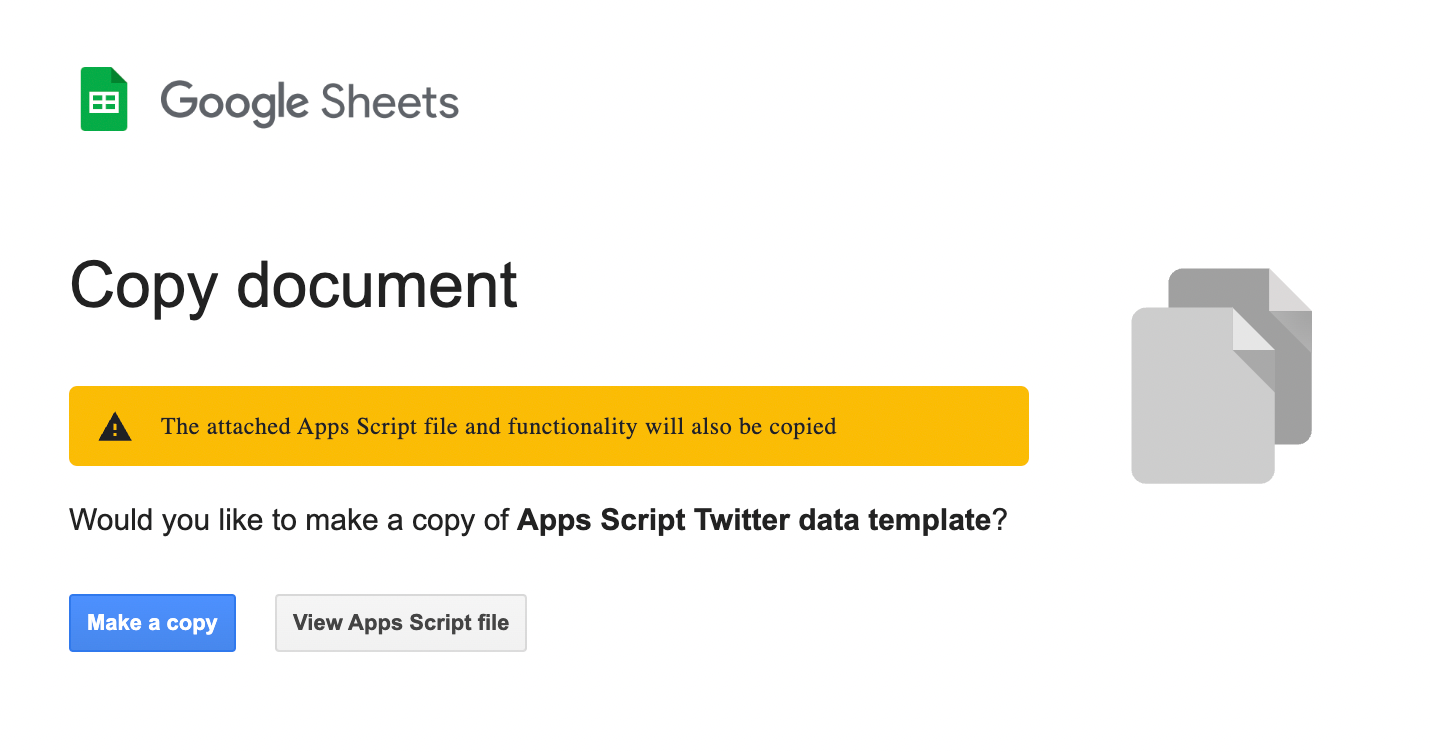
- Click "Make a copy"
- Scroll down to the next section for what to do with the custom menu item
Alternatively: Copy/Paste the code by yourself
- Create a new Google Sheet (sheets.new)
- Click the Extensions menu item, then click Apps Script
- Copy the code from this repository into the Code.gs file and save
- Close the apps script window (return to the Google Sheet).
- Refresh the browser tab, which will load the appscript code, and display a new menu item called "Tweet Data"
Finally, time to run it!
- At this point, you should have an empty google sheet, with a custom menu (pictured below), and only one tab named Sheet1.
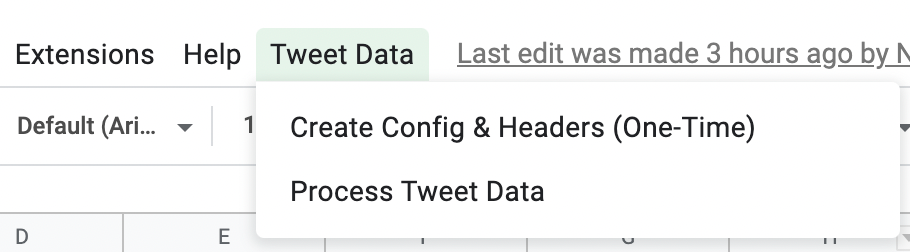
- Click the Tweet Data menu, run "Create Config & Headers (One-Time)"
- This will create a new tab to house the configuration data, and add the first row of headers to the Sheet1 tab
- Fill in the config tab values as described by the comments in the cells in Column B. You'll add the ID of the tweet.js file from google drive, the twitter handle, and you can rename the tab that will house the tabular data if you don't like "Sheet1"
- Now, run the "Process Tweet Data" menu item, and wait for data to show up in the targeted tab. For reference, it took about 10-15 seconds to parse one of my own account extracts, which had 21,738 tweets to process.
- That's it!
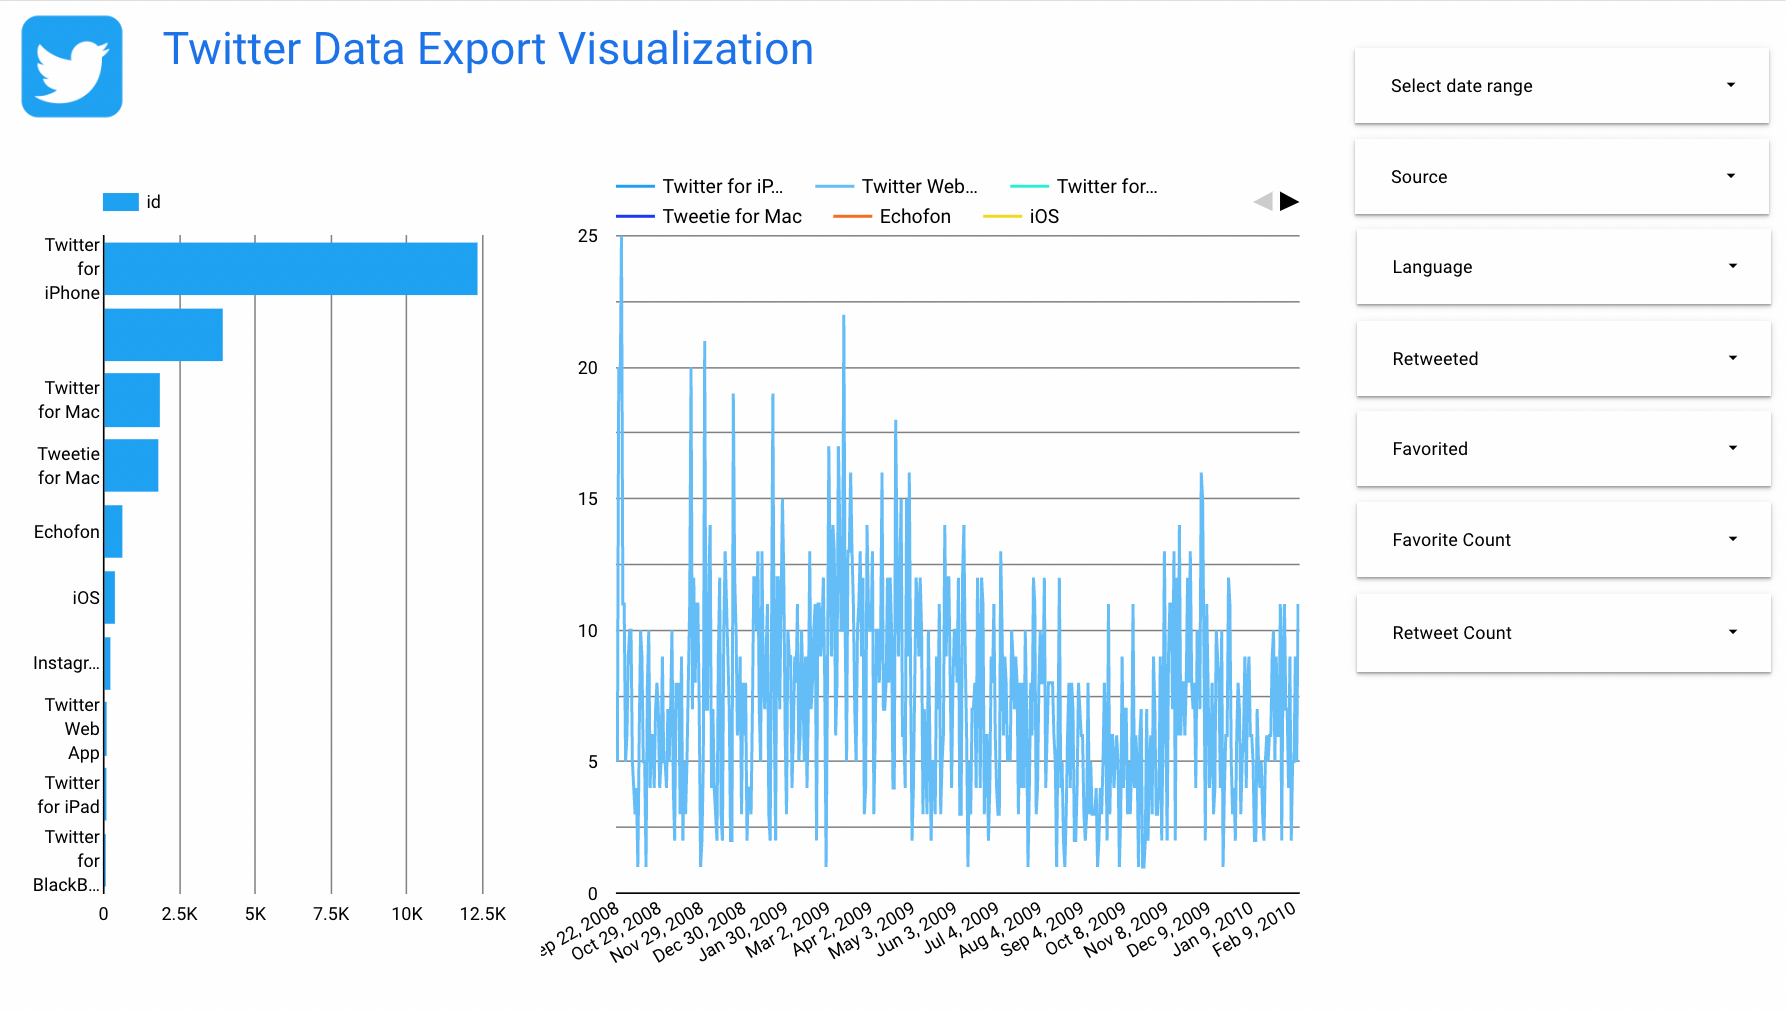
Now, you should be left with a nice sheet full of your tweet data, that you can put into a Google Data Studio dashboard, or Tableau/PowerBI report....or just do some embedded charts inside Google Sheets itself.
As an example, here's a quick data studio dashboard i threw together in a few seconds:

Github Repo for Code: https://github.com/usaussie/appscript-twitter-data
 usaussie
Hopefully this was interesting/useful. If you’d like, you can https://www.buymeacoffee.com/usaussie